EazyBI Reports with Timetracker Data
You can import Timetracker data to EazyBI and create reports based on them, using the worklog data or their billing metadata.
Data Import
Timetracker API Token
Since Timetracker data will be imported as an external data source, using its REST API, you have to first create a REST API Token in Timetracker.
Create Data Source
In EazyBI create a new REST API data source.
For Source data URL, use one of Timetracker’s endpoints, eg. /public/report/details
Set the request method based on the endpoint documentation, eg. POST
If required, set the “Request body”
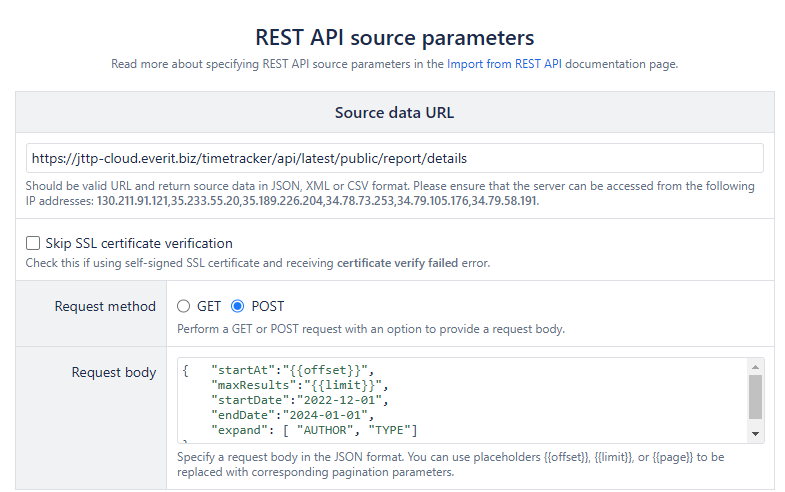
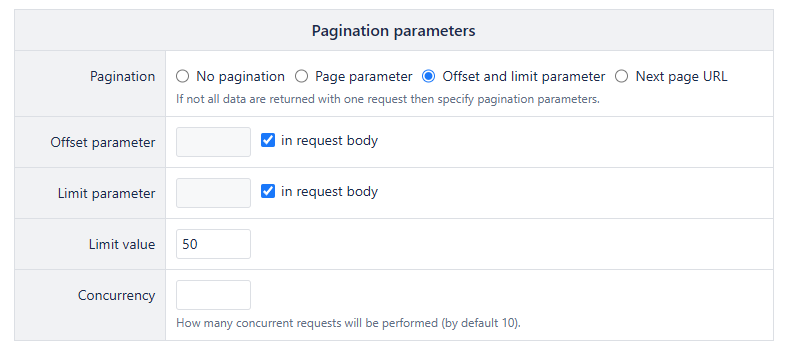
You can set the Pagination parameters in the next section, or use them as defined in the Request Body
Do not forget to define the field in the "expand" property that you want to display! Possible values: ASSIGNEE, AUTHOR, PRIORITY, PROJECT, REPORTER, STATUS, TYPE
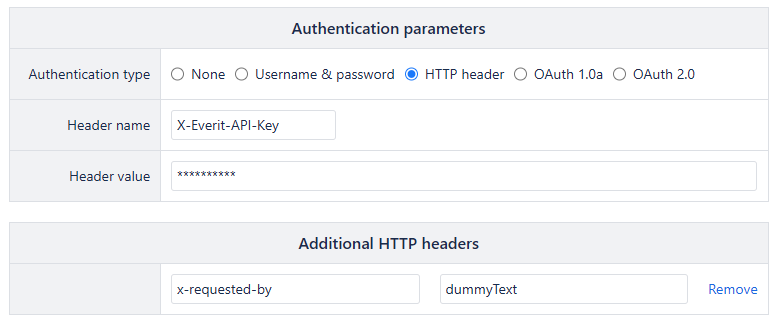
For authentication, use the created Timetracker REST API Token
Also set the “x-requested-by” as an “Additional HTTP headers” if it is requred bassed on the endpoint documentation
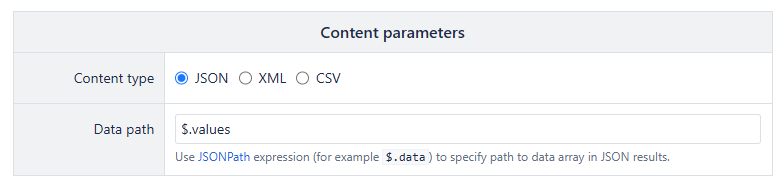
Set the content type to JSON and define the data path
Data Cube
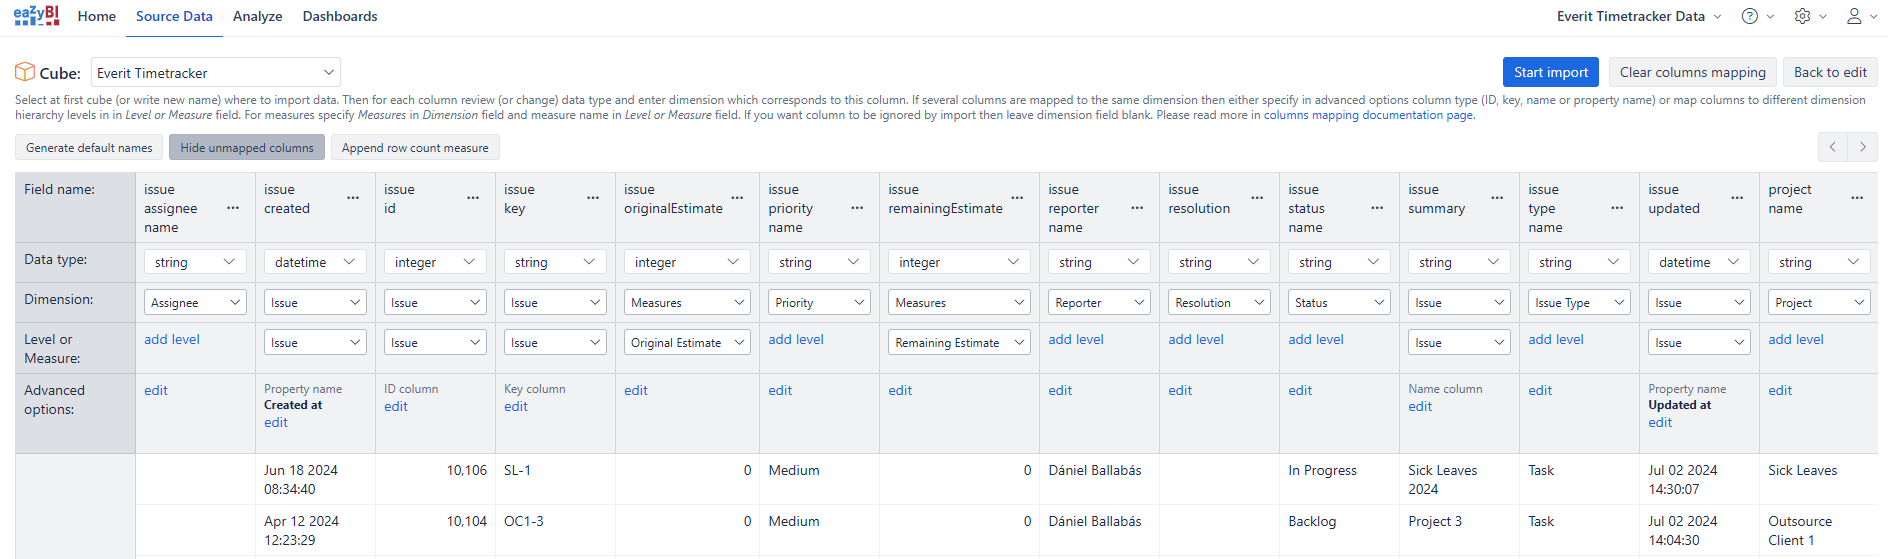
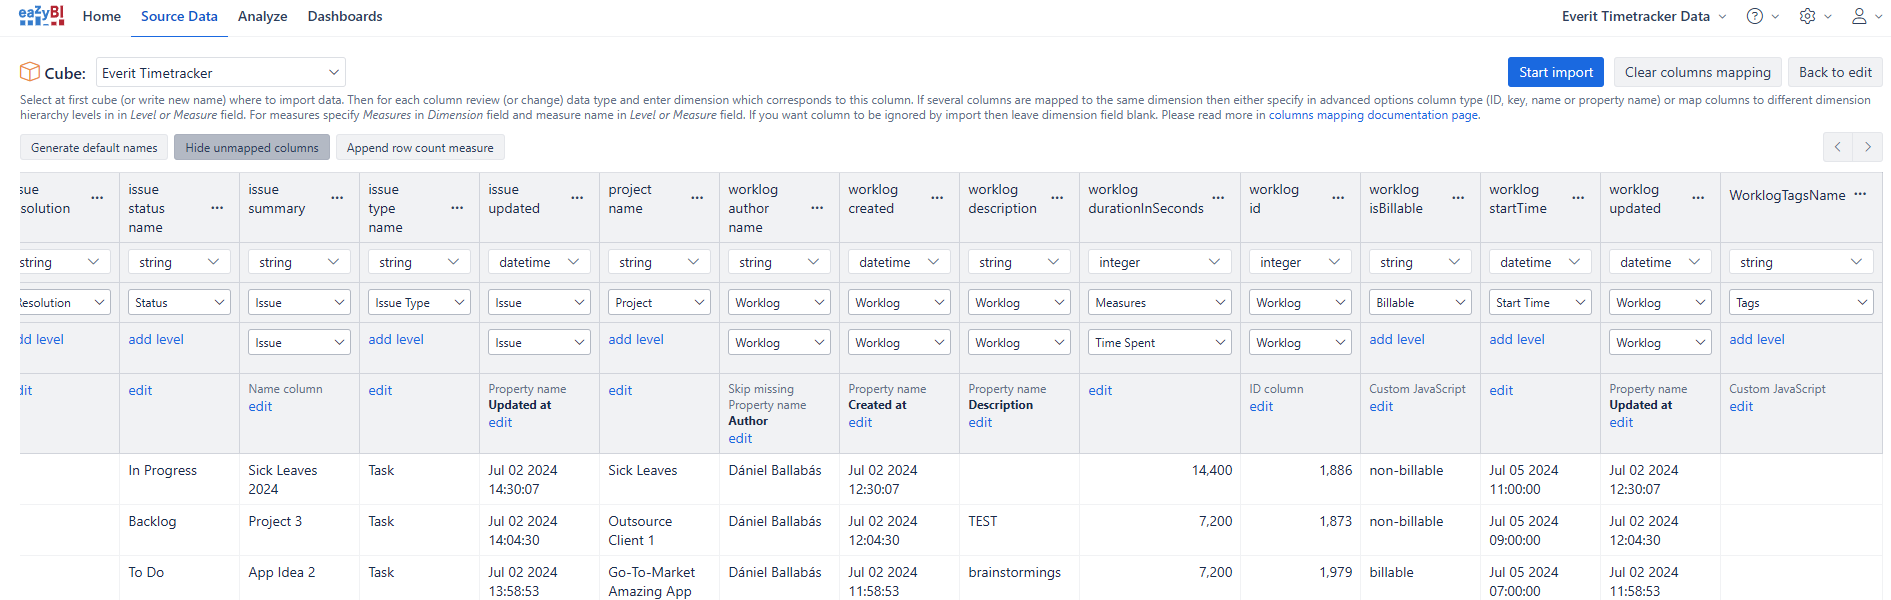
Follow the EazyBI instructons to create the Data Cube: “Select at first cube (or write new name) where to import data. Then for each column review (or change) data type and enter dimension which corresponds to this column. If several columns are mapped to the same dimension then either specify in advanced options column type (ID, key, name or property name) or map columns to different dimension hierarchy levels in in Level or Measure field. For measures specify Measures in Dimension field and measure name in Level or Measure field."
You can map the properties from the Timetracker endpoint as you like to your Data Cube. Below an example how you can map it:
In your reports, the Billing and the Tag metadata can be presented as well. Here are some tips how you can do it.
Billable/Non-billable
The Timetracker Details Report endpoint will give you the status of a worklog as if it is billable or not as a flag:
"isBillable": true,You can confgiure a custom JavaScript in EazyBI to display these as you would see it on the Timetracker Report:
return doc.worklog.isBillable===true ? "billable" : "non-billable"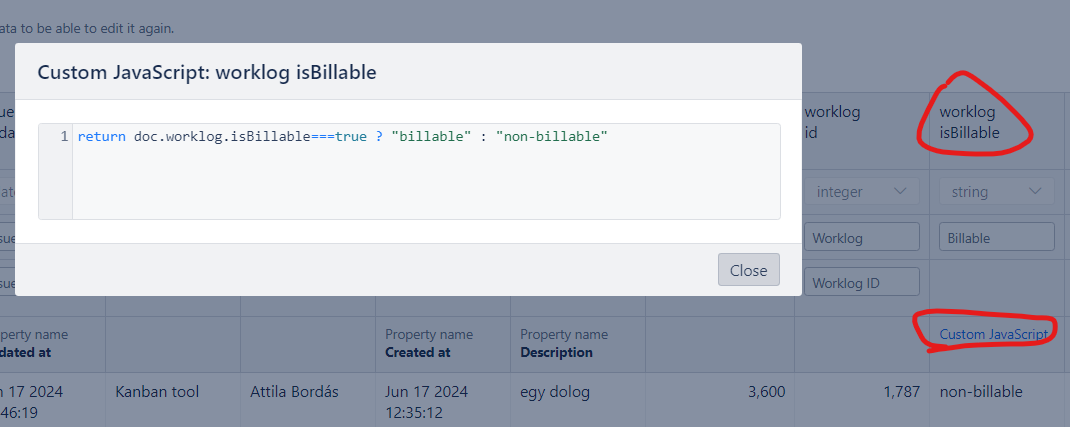
Tags
The Timetracker Details Report endpoint will give you the tags that are assigned to a worklog:
"worklogTags": [
  {
    "id": 5,
    "name": "development"
  },
  {
    "id": 2,
    "name": "testing"
  }
]
You can create a new Calculated Columns eg. “WorklogTagsName” and configure a custom JavaScript in EazyBI to display these as you would see it on the Timetracker Report:
result = [];
_.each(doc.worklog.worklogTags, function(tag) {
result.push(tag.name)
});
return result.join();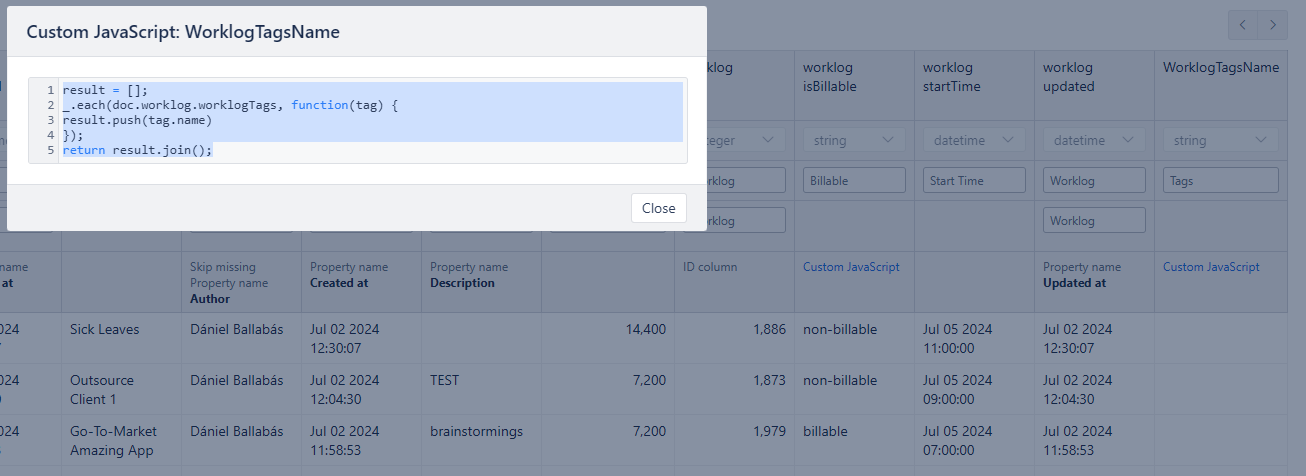
Reports
Time spent format
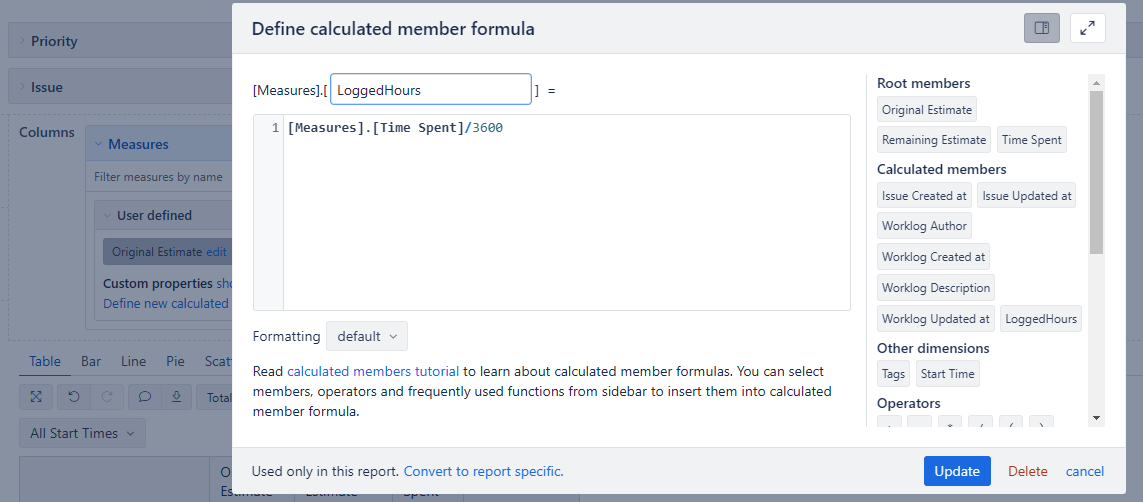
Estimated, Remaining and Time spent will return in seconds from the Timetracker API. However, oyu can easily define new calculated measures to display these in another formet, eg. hours.
Time tracking reports
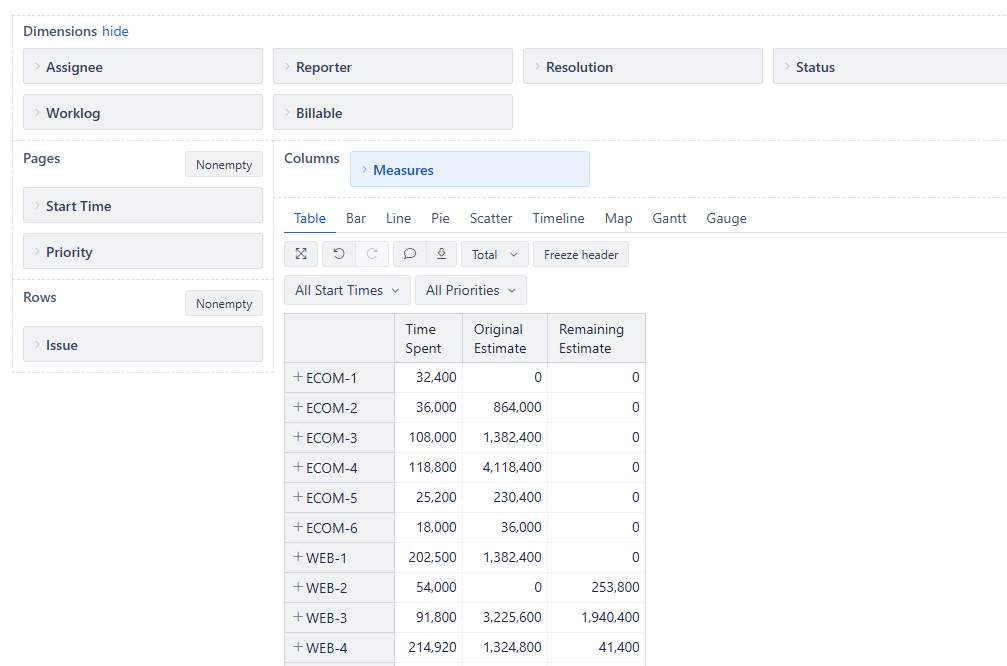
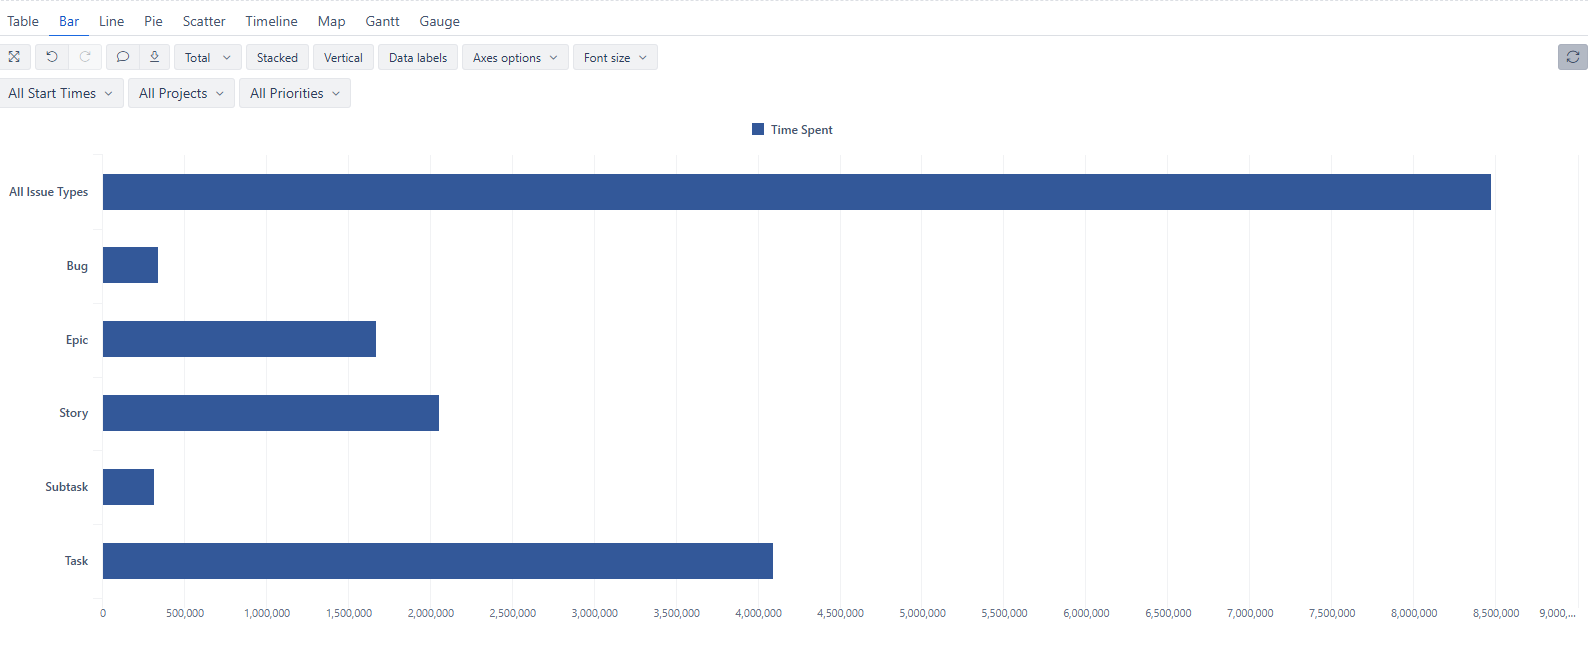
Using our Timetracker data and EazyBI, you can create report about the time tracking values on each Issue, so you can review the progress of the sprint or development.
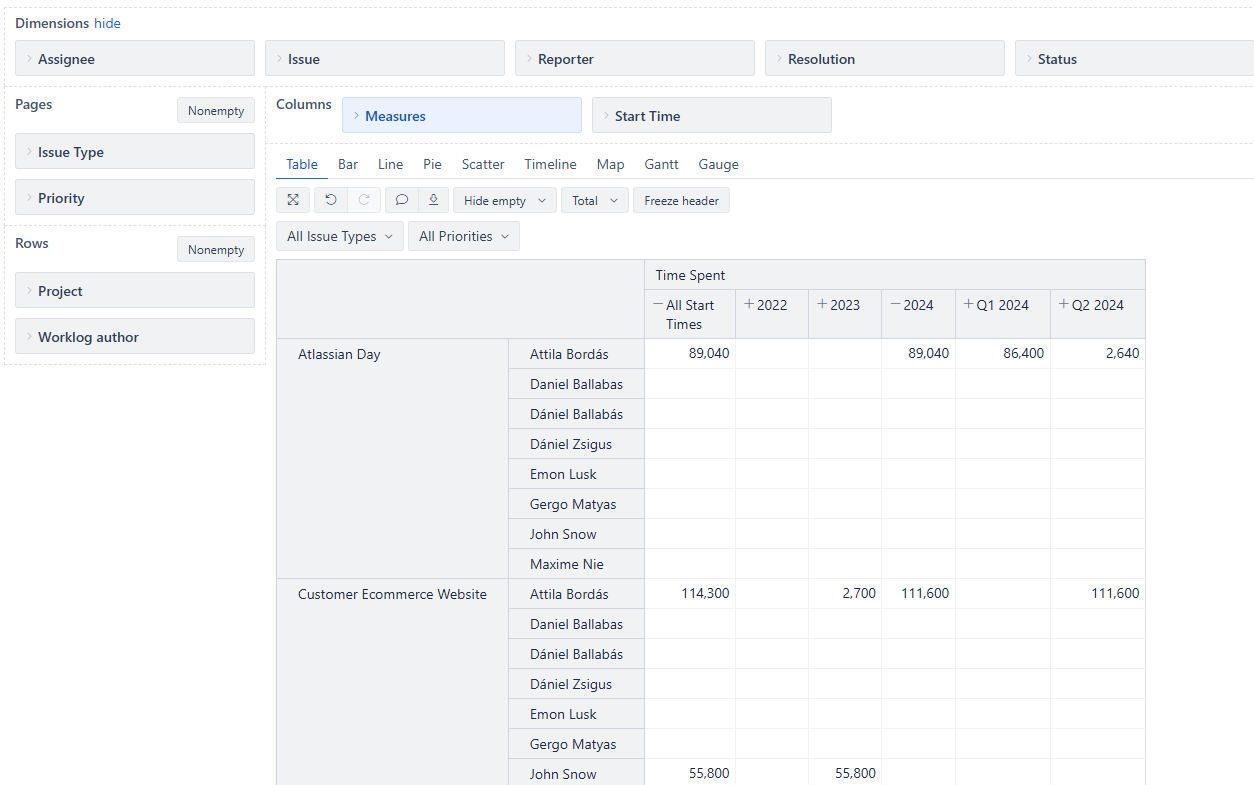
You can create report about the logged times by users grouped by Projects.
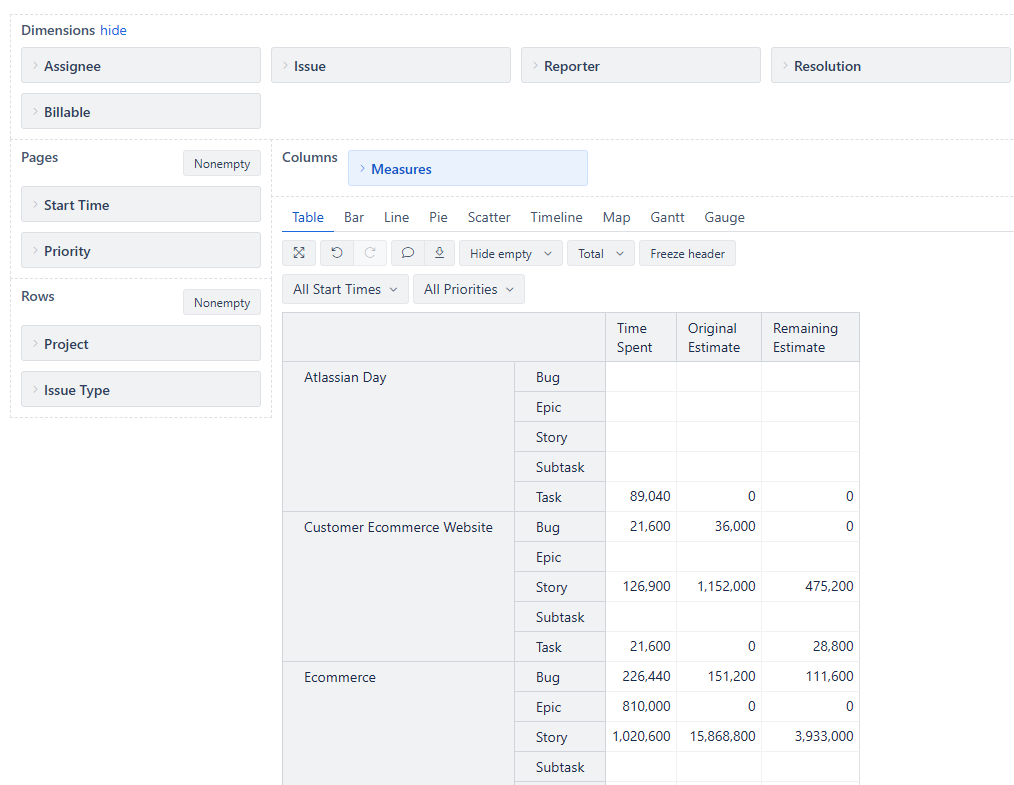
You can create report about the time tracking values on each Issue type grouped by Projects.
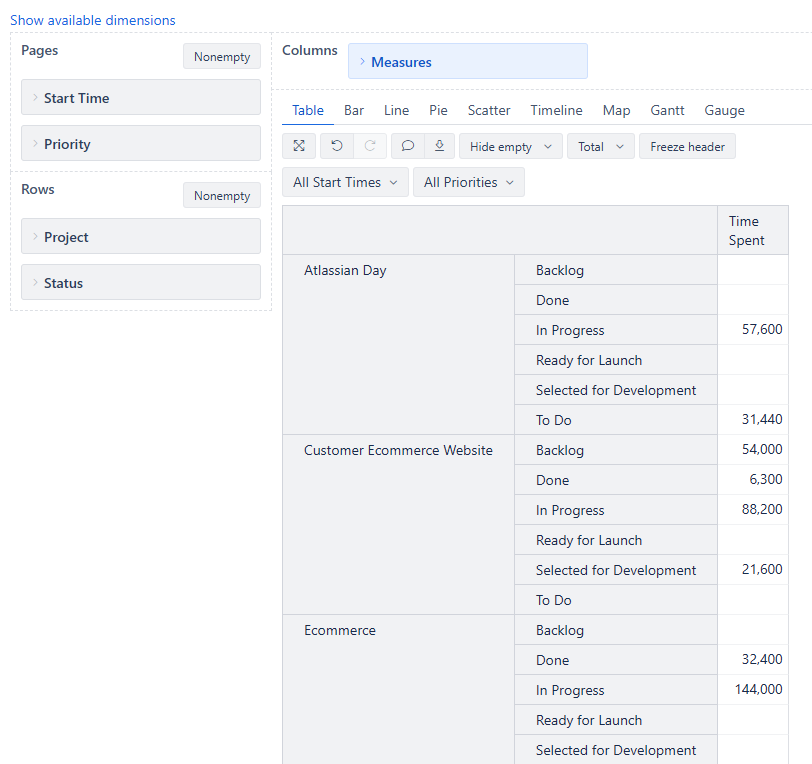
Report about the logged work on the current issue status in each project.
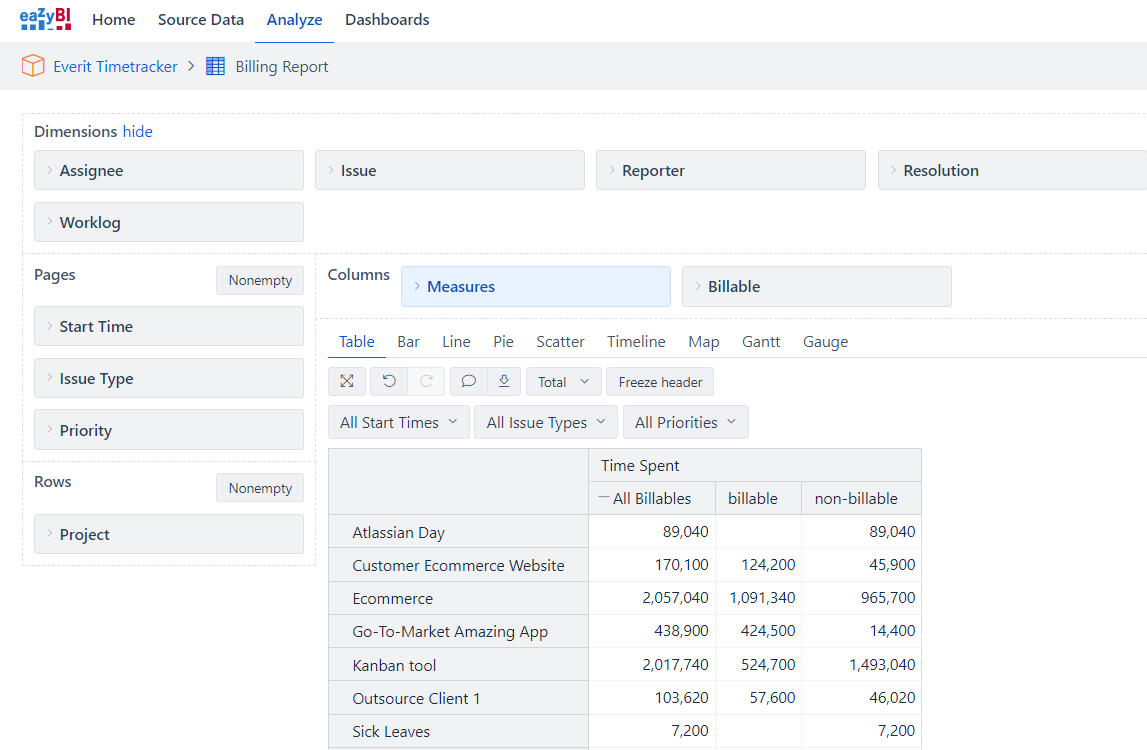
Billing reports
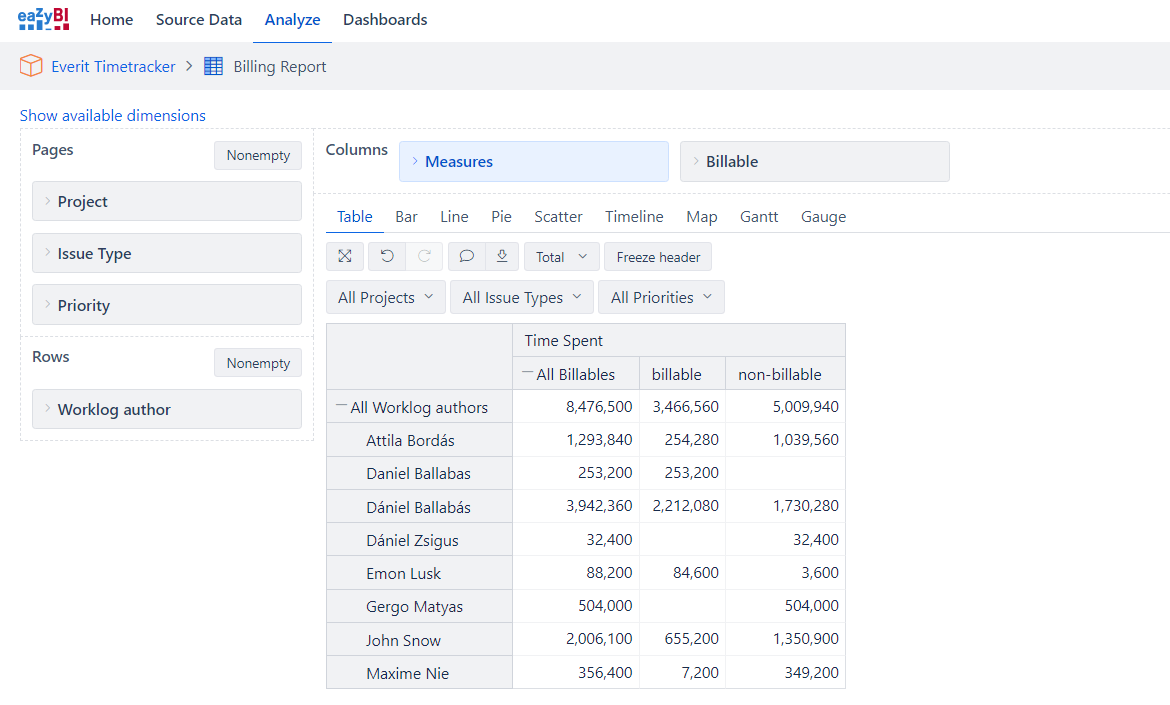
Report about how many billable or non-billable hours have been logged by users. Can be filtered by Projects, Issue Types or Priorities.
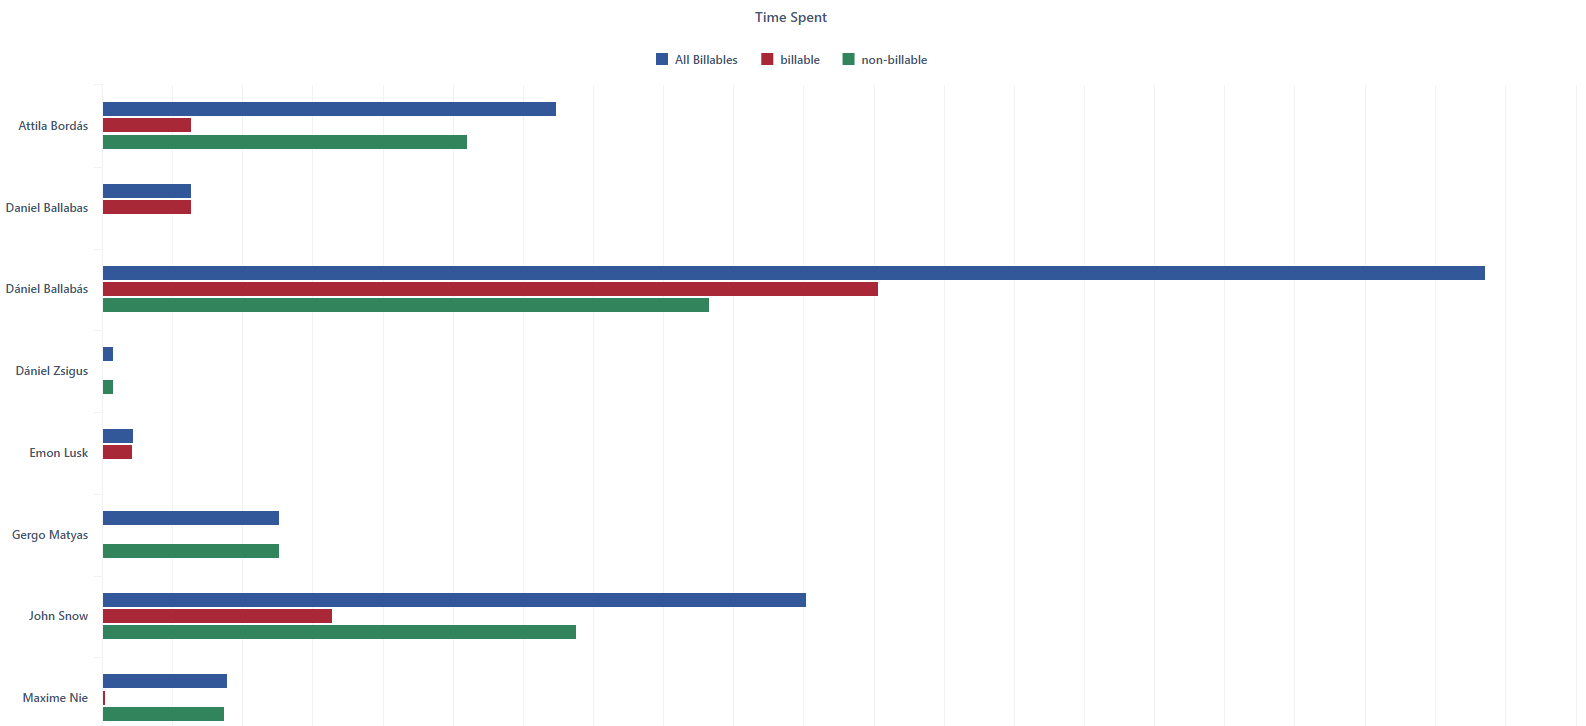
Report about how many billable or non-billable hours have been logged by users per Project.
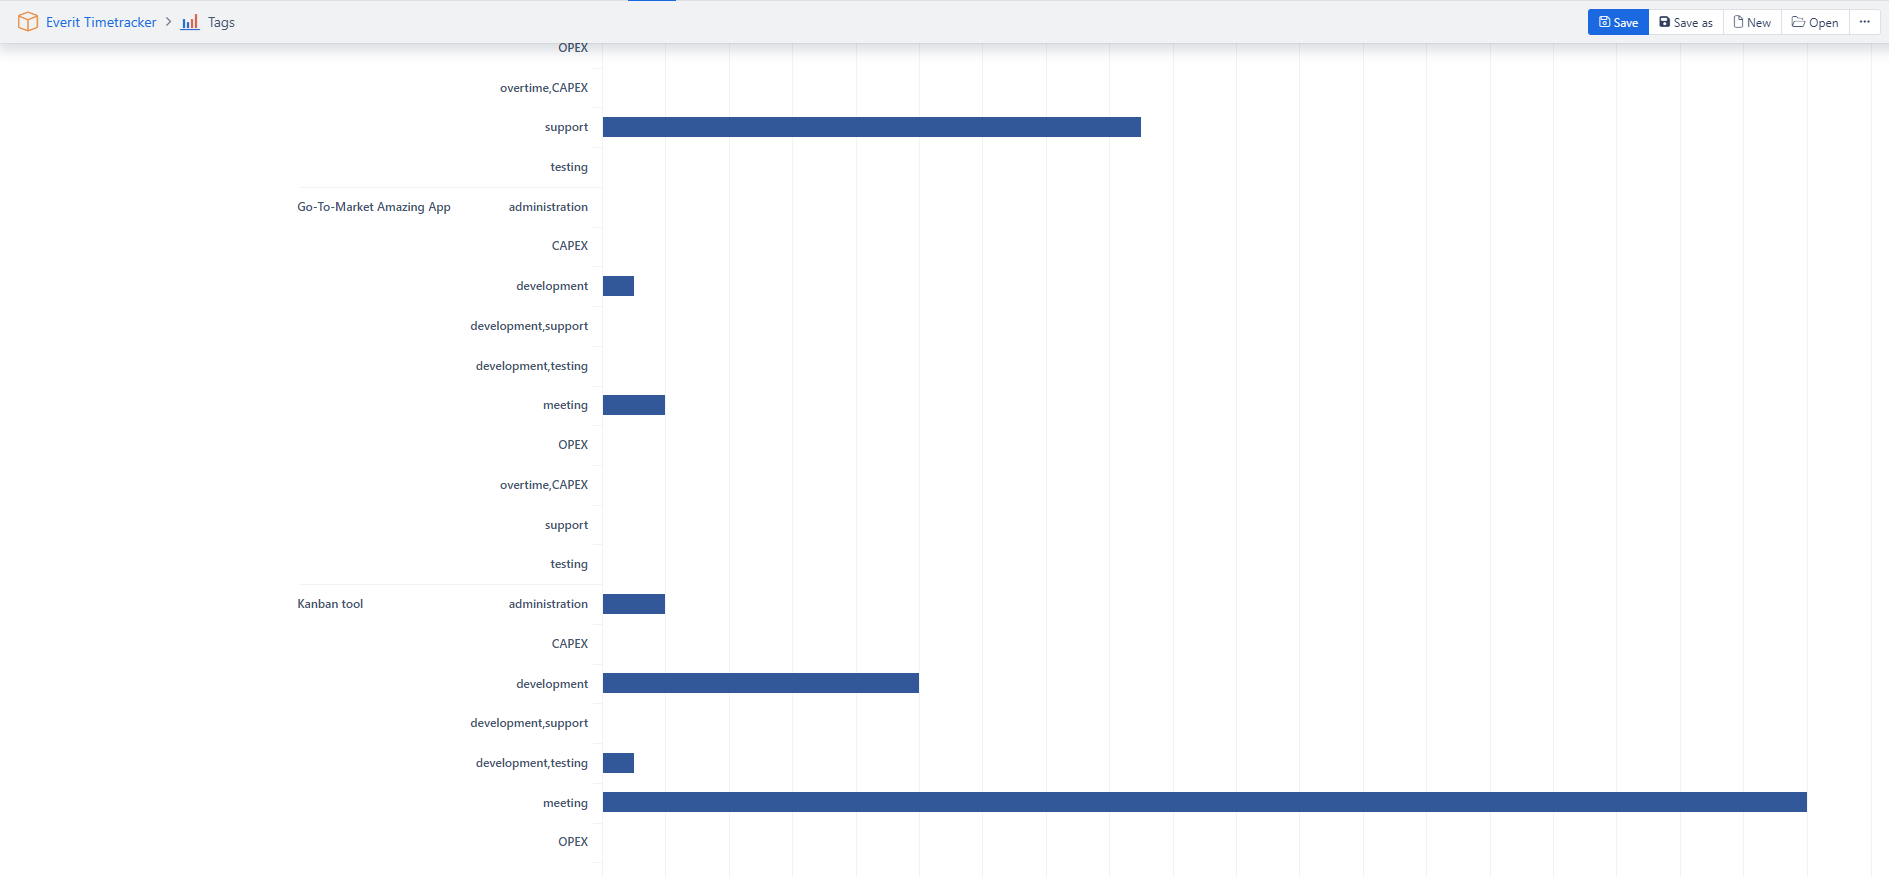
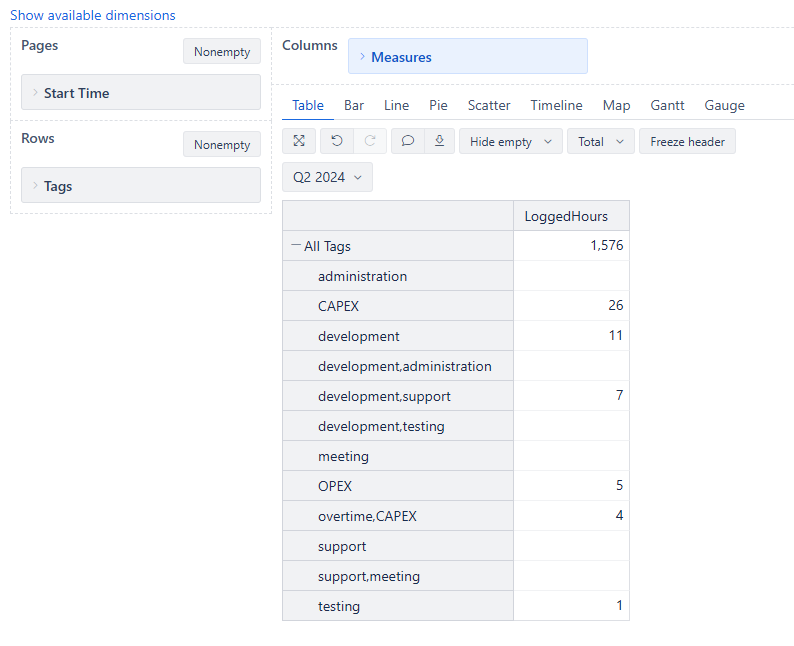
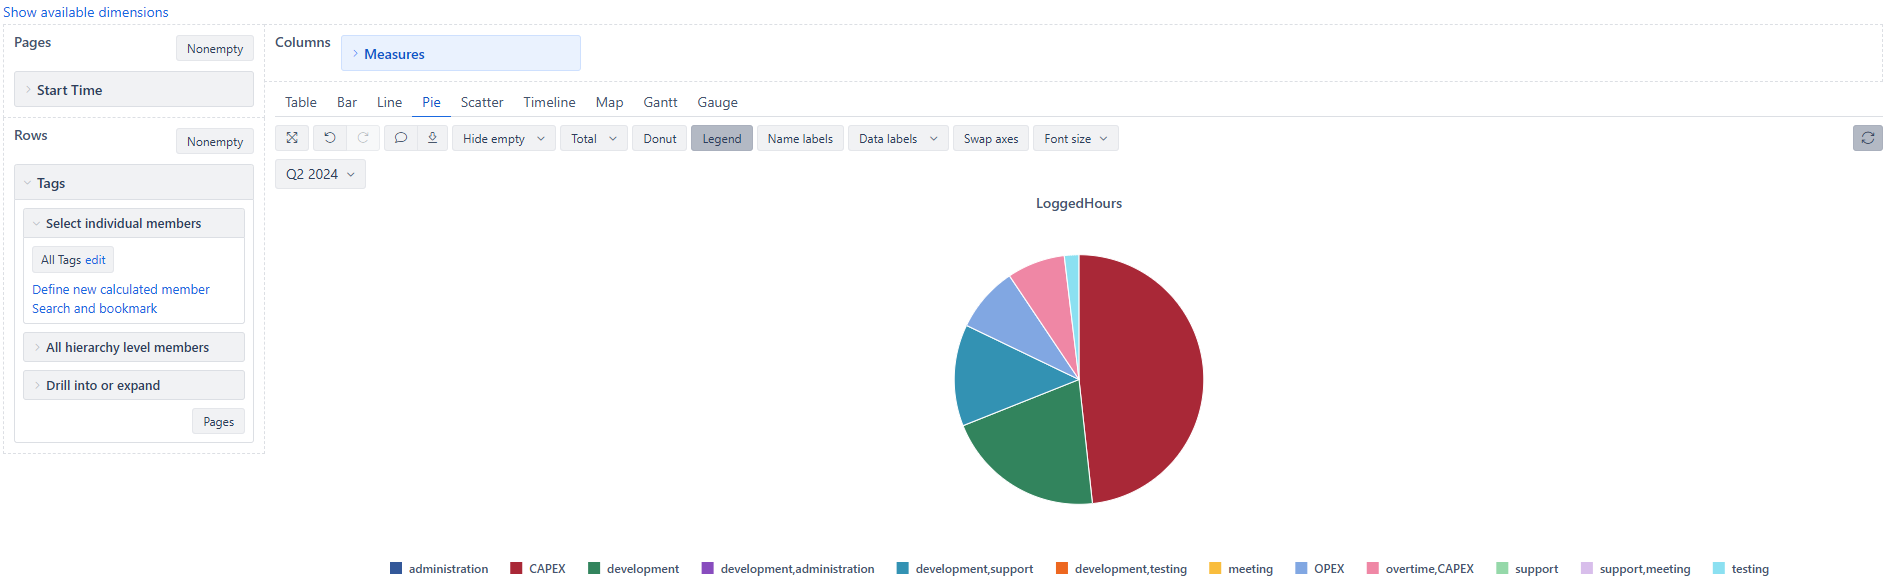
Tags reports
Simple reports about the work distribution between the tags.
Reports about work distribution between tags in each project.