
Chart reports
Chart report will display logged work for the filters by projects, issues, users, versions or components. The logs can be viewed in pie chart and bar chart format.
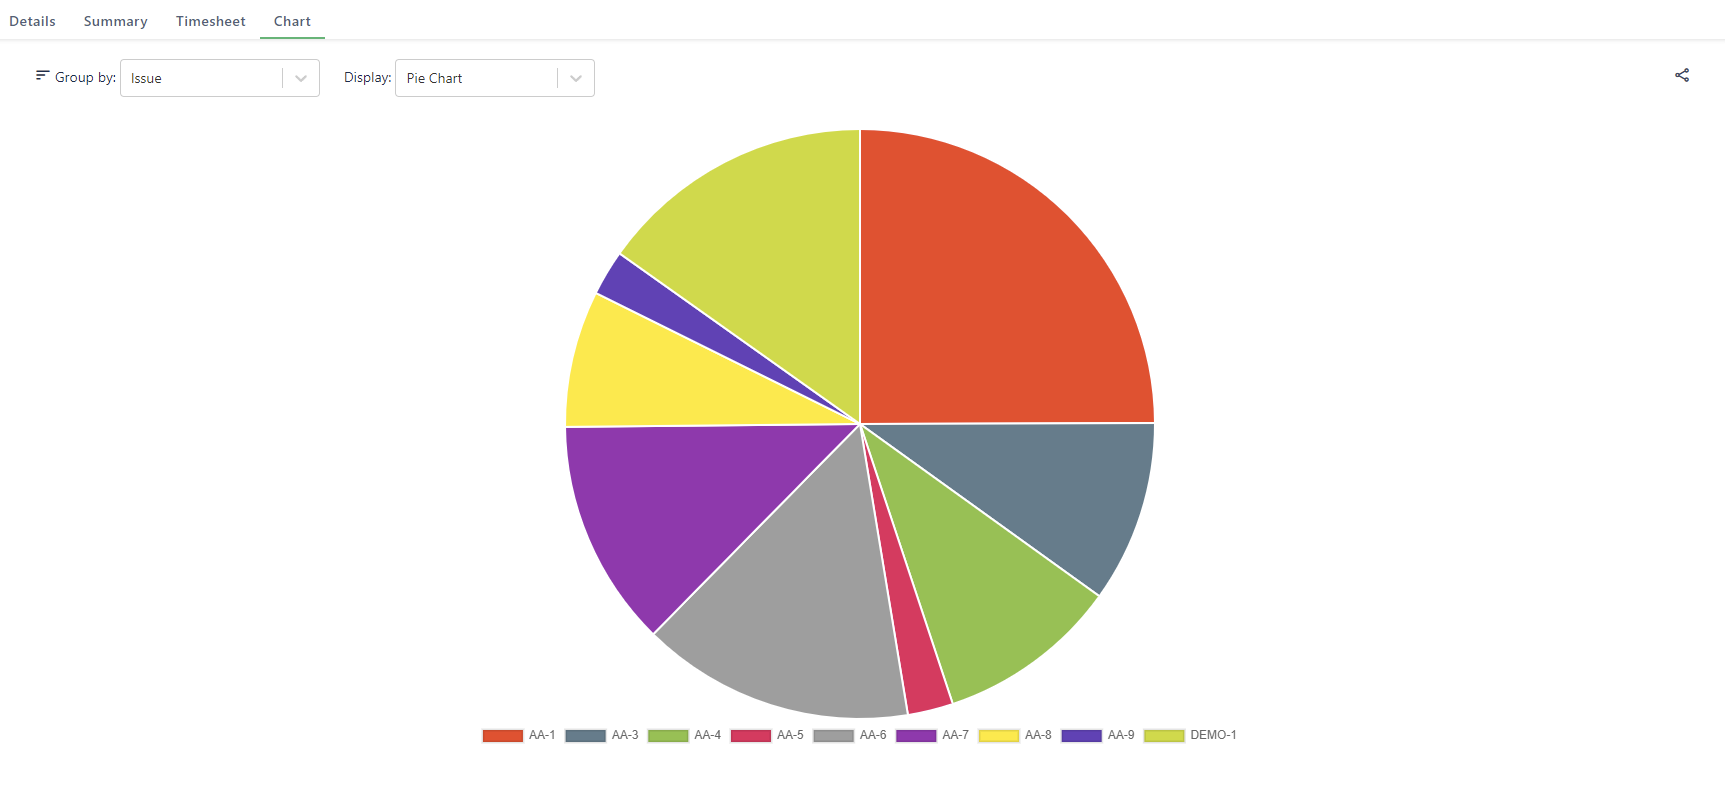
Group by
You can group the result by:
Project: The worklogs will be summarized by project.
Issue: The worklogs will be summarized by issues.
User: The worklogs will be summarized by users.
Affected or Fixed Versions: The worklogs will be summarized by versions.
Components: The worklogs will be summarized by components.
Billable/Non-billable: The worklogs will be summarized by billing.
Tags: The worklogs will be summarized by tags.
Display
You can display the data in two chart format:
Pie Chart: Summarized data will be displayed in a Pie Chart.
Bar Chart: Summarized data will be displayed in a Bar Chart.
Maximum 50 element can be displayed in the chart.